Kubernetes and Site Reliability at N26 – An Engineering Success Story
At N26, our engineering team attacks problems head-on. Here, we tell the story of how we investigated and resolved a mysterious connectivity issue. Read on to discover what happened!
12 min read
N26 recently embarked on a technical shift, changing the way we run our microservices. Because N26 is a fully AWS cloud-based bank, perhaps the simplest way to run microservices is on EC2 machines, or virtual servers. However, we recently decided to adopt and migrate our services to the more abstract and feature-rich alternative, Kubernetes. While the migration was relatively smooth, we began to notice a new behavior when running services on our new platform–network timeouts. This in and of itself wasn’t too alarming–sooner or later every engineer encounters timeouts. Unfortunately, systems tend to get more complex with time, making troubleshooting more difficult and time-consuming. At N26, we’re passionate about monitoring our systems–yet monitoring doesn't always get to the root of a problem. My name is Povilas, and I’m a Site Reliability Engineer at N26. In my team, one of our main responsibilities is to make sure that our bank is running smoothly from a technical perspective. And because we are running complex and distributed systems, we inevitably have to deal with challenging problems–such as the one you’ll soon read about. Dealing with problems like this is why I love my job.
Intermittent timeouts
Our debugging adventure began when engineers observed that one of their service HTTP calls were experiencing a relatively high number of timeouts. This was particularly unusual because this service typically responds in less than 30ms, with the client timing out at 1s. The symptom that exposes this behavior is called “long-tail latency.” It can be checked by looking at your service’s 99th percentile response time.We quickly realized that the service only had problems with downstream services running on Kubernetes. But before jumping into troubleshooting, we'll explain how our services communicate with each other.
Communication path
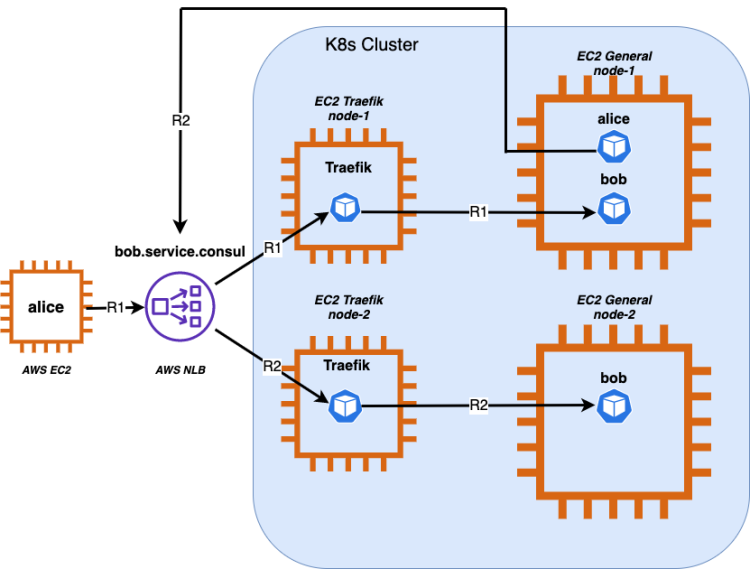
To explain our communication path as clearly as possible, let’s name our client service that’s experiencing timeouts Alice. The server running inside Kubernetes and accepting traffic coming from Alice will be called Bob.The process is detailed in the diagram above. When Alice calls Bob from outside our cluster, Alice resolves our cluster’s AWS Network Load Balancer IPs by querying bob.service.consul DNS. The load balancer is responsible for forwarding TCP packets to our dedicated “traefik” nodes where we’re running our ingress controller, labeled Traefik in the diagram above. Traefik also acts as a “Layer 4” router using IngressRouteTCP custom resources. This approach ensures that we don’t have to deal with TLS termination and certificate management on the Traefik side. The ingress then routes TCP packets to “general” nodes with pods where we’re running our Bob application. TLS offloading happens inside Bob’s pod thanks to a sidecar proxy container Envoy, which then forwards plaintext HTTP requests to Bob application container inside the same pod.While in migration mode to Kubernetes, it’s possible for a service to run on two different platforms at the same time. Thus–in this case–Alice can run both outside and inside the cluster. To simplify our migration and service discovery, we wanted to keep the same interface for how our services are discovering other servers, regardless of where they are running. What’s more, if Bob is moved back to our old platform, Alice should still be able to discover it by querying bob.service.consul. Also, as seen in the diagram, we’re running our ingress controller Traefik on different dedicated worker nodes labeled “traefik” than the rest of our services. We do this to avoid notorious NLB hairpinning problems, when the source and target EC2 instances (machines) are the same.
Debugging
Our initial assessment
After looking more closely at our monitoring and logging data, we were already able to simplify our investigation. The data gathered by our system told us that:
The cause wasn’t inside Bob's pod because timing-out requests weren’t reaching Bob'sEnvoy sidecar.
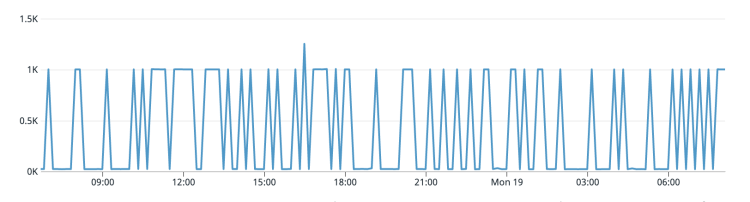
The timeouts didn’t have a clear time pattern. However, they seemed to occur much less often at night.
Because services with very low traffic were also experiencing timeouts, it was clear to us that they were not due to overload.
Timeouts occurred regardless of whether Alice was running inside or outside the Kubernetes cluster.
Kubernetes native communication
The first thing we did was try to bypass AWS NLB and Traefik in our communication path. We did this by changing Alice’s configuration,which was running in Kubernetes. Our team configured Alice to use Kubernetes service to discover Bob. Instead of using bob.service.consul DNS it would use Kubernetes service (bob.bob.svc.cluster.local) to discover Bob. This kind of change is only possible if Alice is also running inside the Kubernetes cluster. After doing this, the timeouts were gone. This narrowed down our investigation to two components, AWS NLB and Traefik.
A closer look at Traefik
Because we were already using AWS NLB before introducing Kubernetes and Traefik, it made sense to start troubleshooting Traefik, a new technology in our infrastructure, as we hadn’t experienced problems with the AWS NLB before.One of Traefik’s shortcomings as a Layer 4 router is that its provided network layer monitoring isn’t top-notch. Therefore, we decided to enable Layer 7 and terminate TLS exclusively for Bob’s ingress route using IngressRoute. However, a tracing produced by Traefik showed us that timing-out requests also weren’t reaching our ingress controller. This left us with a single component that could be responsible–AWS Network Load Balancer.
Tuning AWS NLB
AWS NLB is already infamous for its connection problems, some of which are detailed in their troubleshooting documentation. In short, timeouts occur for two main reasons:
Client IP preservation and source nodes hitting the same target node–also known as hairpinning.
AWS NLB silently kills connections that are idle for longer than 350 seconds.
We ruled out the first cause by moving Traefik pods to dedicated nodes, ensuring that client pods weren’t running on the same machine. Plus, we knew that Alice’s idle timeouts were shorter than 350 seconds.Despite this, we did a “sanity test” to completely rule out these causes. To do this, we disabled client IP preservation on our NLB and made sure that Alice wasn’t using persistent connections. However, as we expected, this didn’t yield any new results. Thus, our next step was to inspect how the TCP packets were flowing.
Chasing TCP packets
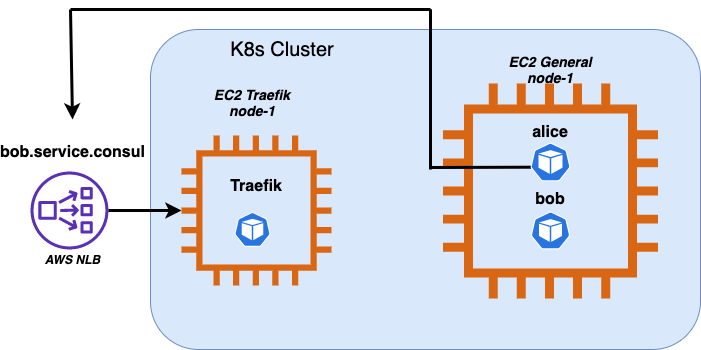
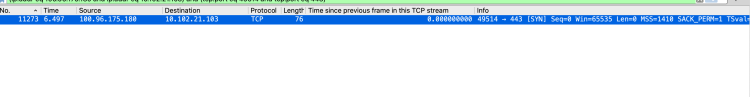
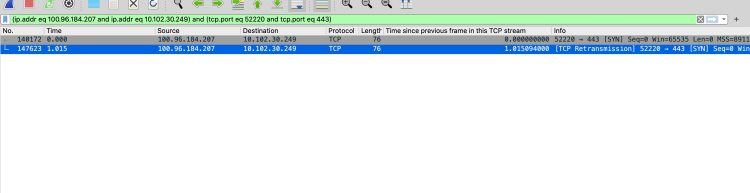
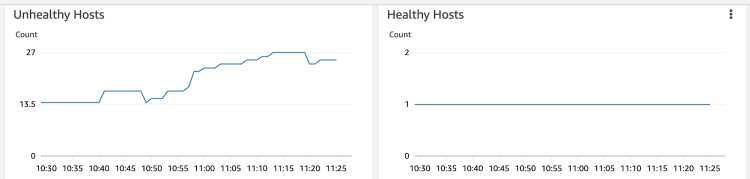
Before inspecting TCP packets with the widely known tool “tcpdump”, we decided to reproduce the timeouts in our development environment–offering us a better debugging experience. In this way, we were able to observe the intermittent timeouts within our development cluster. However, we couldn’t cause timeouts on demand–we had to wait for them to occur naturally. We also decided to reduce the Alice and Traefik pods to one singular pod. This simplified our troubleshooting process because we now knew which client and server nodes needed to be investigated.Here’s a diagram detailing our simplified communication path:We were focused on TCP packets that were leaving the “general” instance and coming to the Traefik instance. Unfortunately, AWS NLB is a bit of a black box here, and we just needed to trust AWS. After running “tcpdump” for a while and uploading a huge amount of data to Wireshark, we instantly found some interesting TCP streams on the client node.The image above shows how Alice is sending TCP SYN, but isn’t getting any SYN/ACK from the server-side. This in turn prevents Alice from establishing a TCP connection. TCP has a mechanism called retransmission, which ensures that data is being reliably sent from end to end. However, we didn’t notice any retransmission in this TCP stream due to TCP Retransmission Timeout (RTO). The initial value is 1 second, exactly the same amount of time as Alice’s HTTP timeout. Hence, Alice terminated the connection faster than the TCP SYN packet was re-sent. Unfortunately, the initial RTO(1 second) value is hardcoded in Linux Kernel and can’t be changed. There’s some debate as to whether it’s not too high as a default value, especially in cloud and internal network environments. You can read more about the initial value rationale in RFC6298.With this information, we did another “sanity check” and increased Alice’s HTTP timeout to 2 seconds. This time we observed retransmissions in misbehaving TCP streams:However, Alice still couldn’t get any SYN/ACK from the server-side even with retransmission.The next step was to check the TCP dump gathered on the “traefik” node, where we were expecting to see incoming SYN packets. One good thing about AWS NLB client IP preservation is that it preserves not only source IP but also source port. This extra information simplifies TCP stream tracking between two machines. So, in our case, we just needed to filter TCP streams on the “traefik” node with a source port 52220. We saw nothing, which surprised us. There was no trace of TCP SYN with source port 52220 coming to the “traefik” node. We looked for the dropped packets, invalid conntrack inserts, and misconfigured iptables–but everything screamed that the TCP SYN leaves the “general”(client) node and isn’t reaching the “traefik”(server).We could only come up with two theories–either AWS NLB was randomly dropping TCP packets, or AWS NLB was sending the misbehaving packets to a different machine. The former was very unlikely because it would make NLB a very unattractive AWS offering. The latter is more likely–but the question is how. We only had a single “traefik” node, and we confirmed that in AWS NLB target group monitoring:As you can see, the healthy hosts' count was always at 1. Thus, the traffic should only go to that machine. The unhealthy host count is dynamic because it represents our cluster autoscaling with worker(“general”) nodes. Those “general” nodes are not running Traefik pods, hence they’re marked as unhealthy by AWS NLB.
Investigating VPC flow logs
To confirm our theory that AWS NLB was sending some TCP packets to a different machine, we needed a method that would show a destination IP for packets leaving the load balancer. Basically, we wanted to get all packets with source port 52220 where the destination address was different than what we were expecting. And, surprisingly, we found the packet! We quickly copied the destination address 10.102.24.48 and put it into EC2 search input to identify the culprit. Interestingly, the destination machine was one of our cluster’s “general” nodes. Plus, we were able to verify that all stuck TCP SYN packets were going to these “general” nodes. This was strange. We’d already clarified that only “traefik” nodes should receive traffic because they’re running our ingress pods. As we confirmed via NLB monitoring, we only had a single healthy host. So how was it possible that Network Load Balancer was sending packets to unhealthy “general” nodes?
Unraveling the mystery
By looking deeper at the misbehaving packets and respective destination machines, we found one interesting correlation. The stuck TCP SYN packets were only going to “general” machines, which had been launched one or two minutes prior. This discovery was huge because we could then easily test it by adding a new “general” node to our cluster to look for timeouts. And there it was! The timeouts were happening the very same moment we added a new “general” node. Since our cluster autoscaling was enabled, this explains why we couldn’t find any pattern in when these timeouts were happening. Clusters can add new nodes due to an increased load on services, or just because a new application is onboarded to Kubernetes.Having gathered all this information, we came to the conclusion that when a new node joins AWS NLB its initial state is “healthy” until proven otherwise by NLB health checks. This wasn’t what we’d expected. Any engineer would expect that the initial machine state is “unhealthy” until it passes health checks.
AWS Confirmation
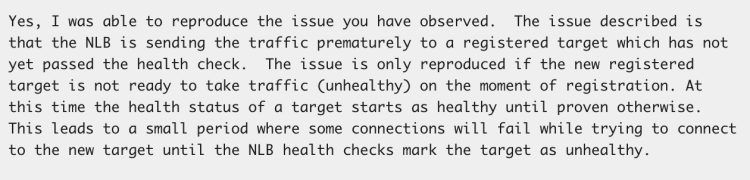
To confirm our conclusion, we asked AWS Support straight away if our observations were correct. Here’s what they had to say:Finally, the mystery was solved!
Mitigation
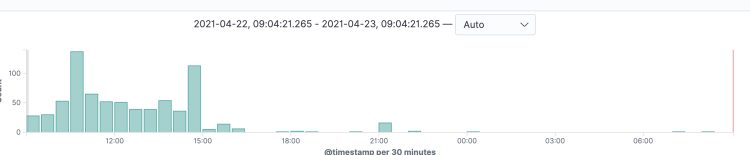
Once we knew the root cause of the network timeouts, the process of getting rid of them was simple. By default, the Kubernetes AWS cloud controller adds all the cluster nodes to the AWS NLB target group. Luckily, Kubernetes version 1.19 introduced a new Service annotation which makes it possible to filter which nodes to add to NLB. In our case, it was just a matter of adding the new annotation to our ingress Service resource:service.beta.kubernetes.io/aws-load-balancer-target-node-labels: workload-type=traefik With this change, only nodes with the label “workload-type=traefik” were added to AWS NLB. That means that only nodes with running Traefik pods will receive traffic.After making this change, we looked at our monitoring data and confirmed that the timeouts had reduced drastically.However, our mitigation hasn’t removed timeouts completely, because “traefik” nodes can scale out and add new nodes, which then triggers this AWS NLB “feature”. However, because the “traefik” group was very static, we were very happy with the observed results.
All’s well that ends well
For our team, the lesson was that we can’t discard misbehaviors from AWS services during our root cause investigations. In this case, AWS NLB was marking the newly launched target nodes as healthy even before passing their health checks. Luckily, the mitigation was pretty straightforward when the root cause was identified.This is a great illustration of how packet analysis and our monitoring tools helped N26 identify and fix the issue. And, more importantly, it showed us how well cross-domain collaboration works at N26, which was vital in troubleshooting these kinds of problems.If you find these kinds of experiences exciting and want to join a team of dedicated problem-solvers at N26, why not check out our open roles and help us create a bank the world loves to use!