How to understand candlestick patterns and read stock market signals
Candlestick charts are a simple visual representation of what’s going on in financial markets. Find out how they reveal stock market trends — no matches or lighter fluid necessary.
6 min read
To the uninitiated, the term “candlestick patterns” might sound old-fashioned and even a bit spooky — not something you’d associate with the fast-paced, technologically advanced financial world. But these kinds of candlesticks are essential for investors as they try to decode market signals and spot when a trend might be heading in reverse. Here, we’ll cover candlestick charts, how they can help with more informed trading decisions, and how they reveal stock market trends — no matches or lighter fluid necessary.
What are candlestick patterns?
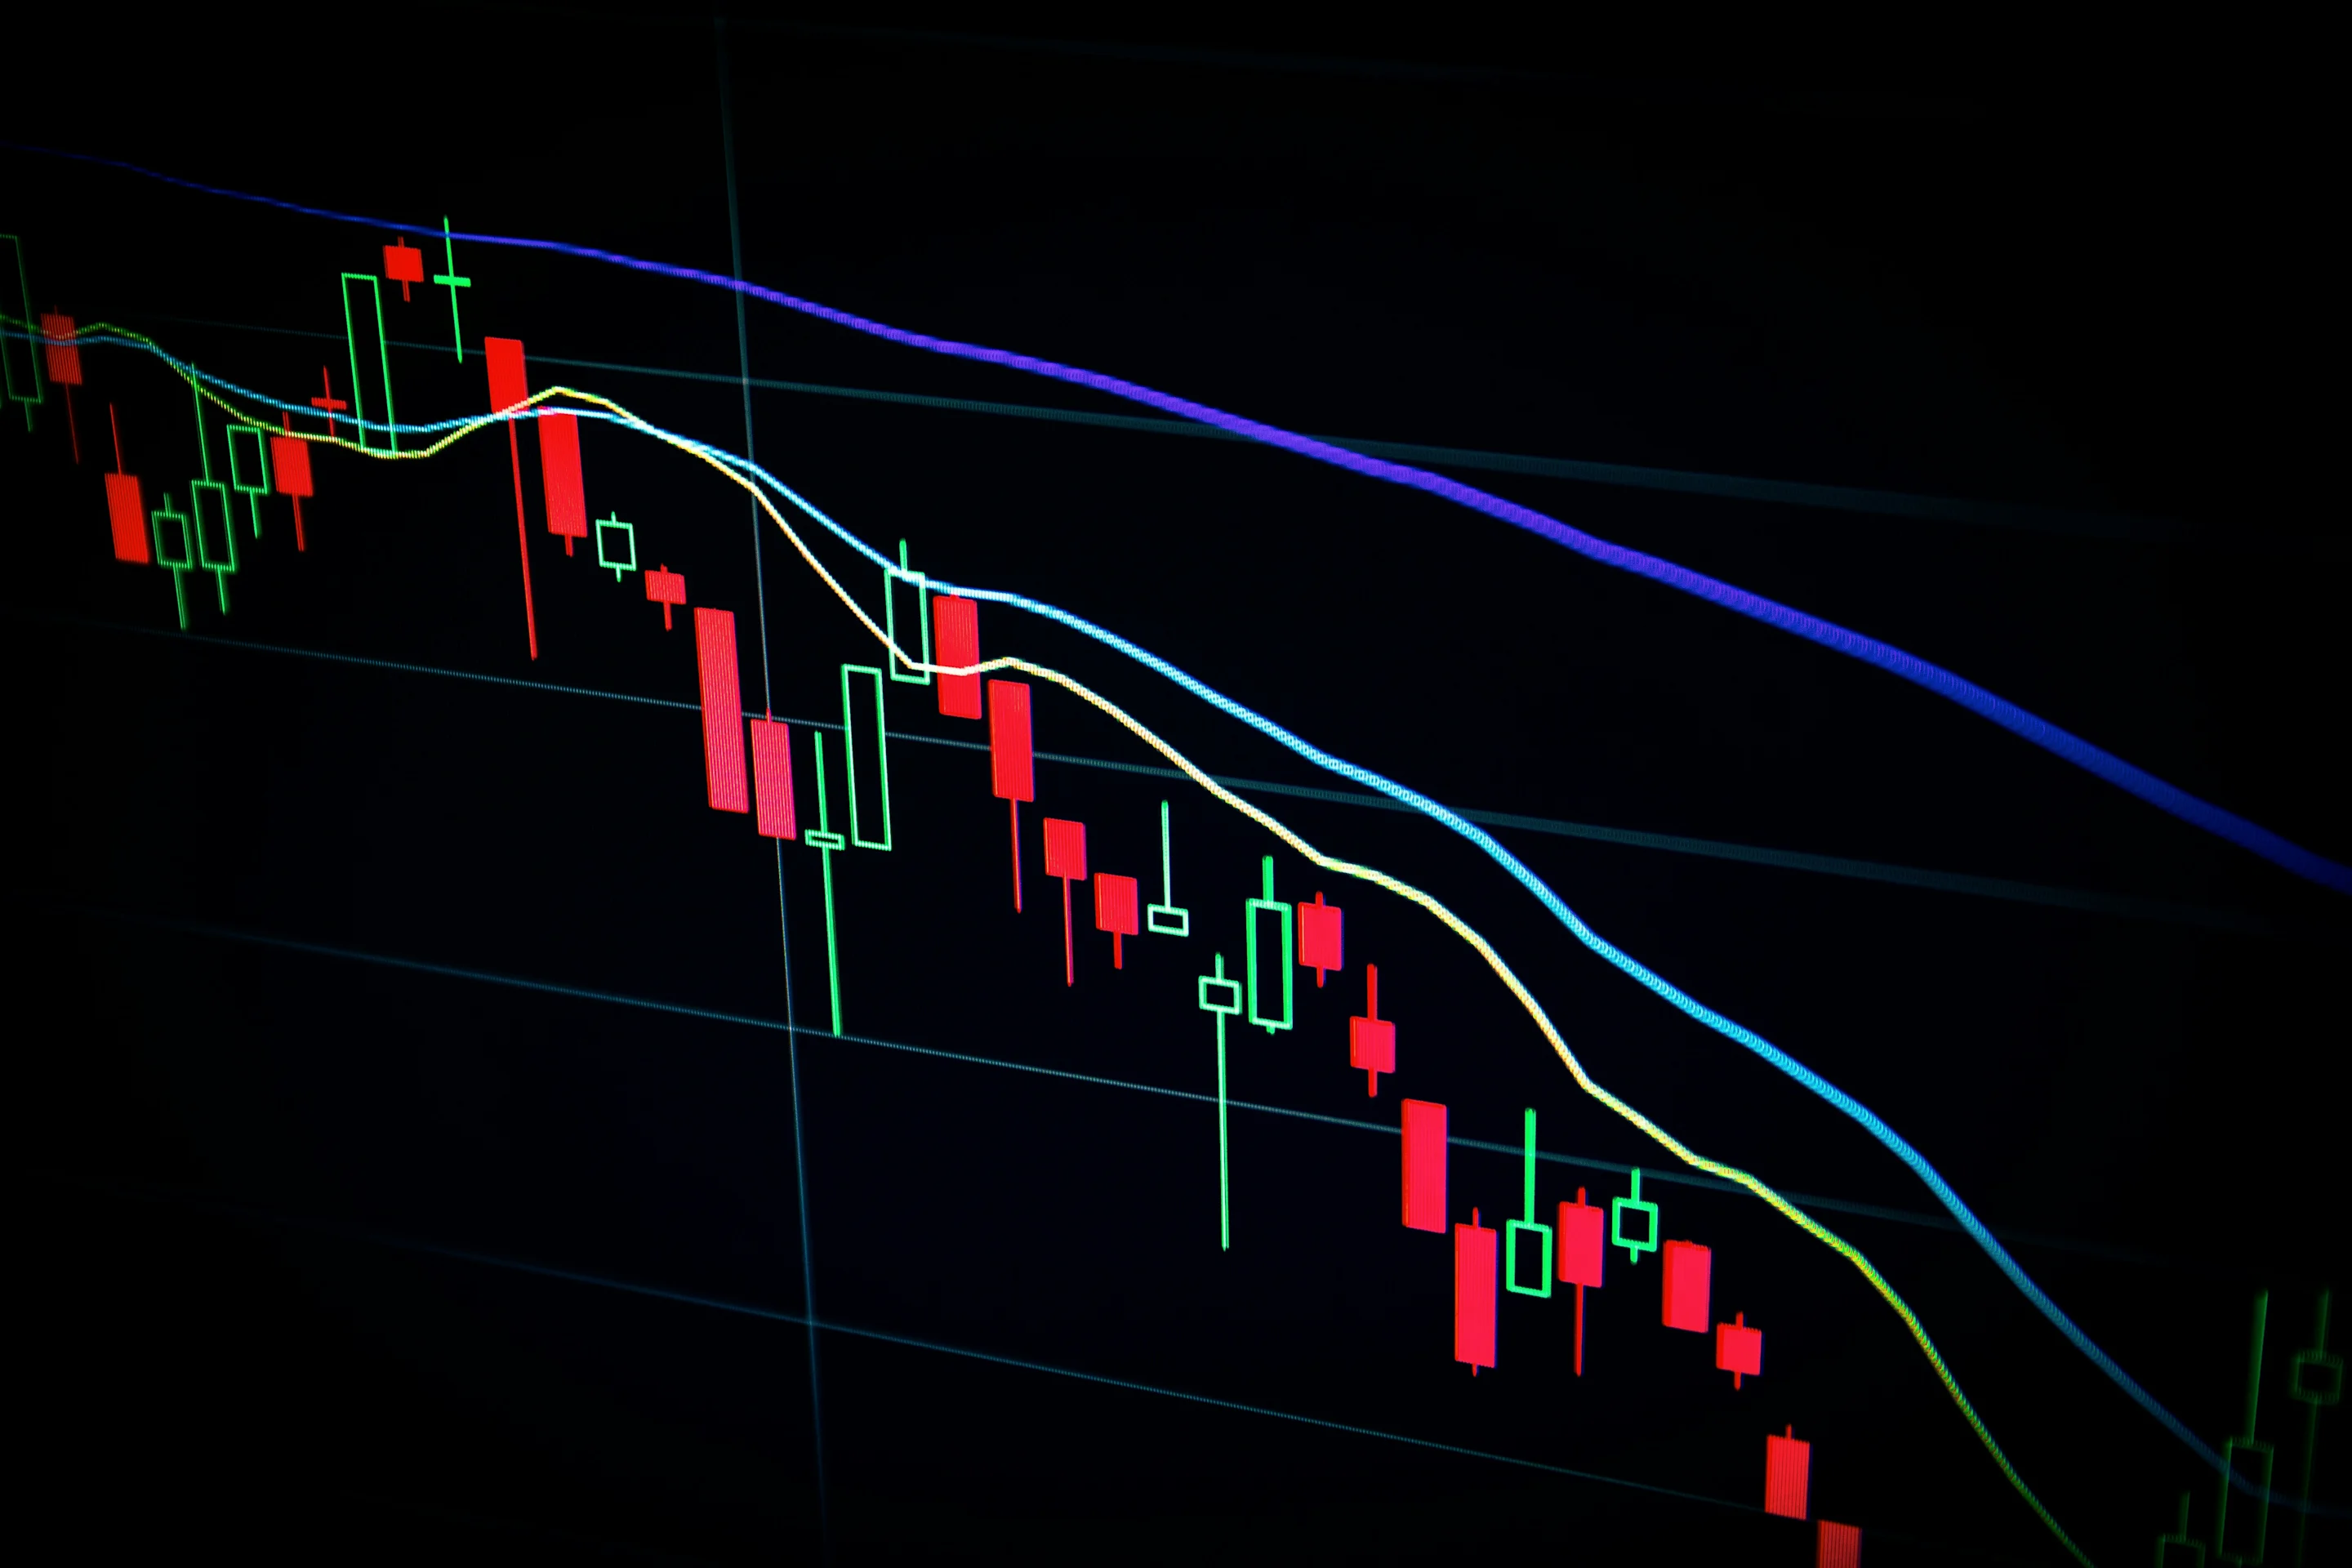
As the name hints at, candlestick patterns have been around for a long time. They originated in 18th-century Japan, where rice traders needed a reliable way to visualize daily price movements and the mood of the markets. These traders developed a system to capture the open, high, low, and close prices of rice contracts over a given period, clearly showing how the market moves up and down.Each candlestick on a candle chart represents the range between the open and close prices during a specific period. When the closing price is higher than the opening price, the market is considered bullish and the main part of the candle — called the “body” — is typically a lighter color. If the closing price falls below the opening price, the market is considered bearish and the body is usually shown in darker tones. The wicks, also known as shadows, extend from the body to highlight the extremes of the trading session. The upper wick represents the highest price reached during the session, while the lower wick shows the lowest price. The length of the wick is a signal of how extreme the price movements were during the session. Together, the body and wicks give investors a lot of visual information about price action and market sentiment. The precise details of the open, close, high, and low values combine to form recognizable trading candle patterns, and this visual representation helps investors quickly understand how the market is moving. In particular, traders use candle charts to evaluate price movements and to spot trends and potential reversals in the stock market.
Forget about fees with N26 Standard
Discover 100% digital banking with zero hidden fees. Open your bank account in 8 minutes, right from your phone.
Candlestick patterns are divided into single and multiple candlestick patterns. Each type of pattern can suggest different trends or signals.
Single candlestick patterns
Single candlestick patterns capture key signals from individual trading periods, so they give a tighter, close-up picture of what the mood is like in the financial market. Generally, these patterns show short-term shifts in buyer and seller activity.
Hammer — a small body near the top of the candle, with a long lower wick. This pattern indicates that there was strong selling pressure but that the price recovered before the trading session ended.
Doji — a candle with a very small body.A doji shows that the opening and closing prices were almost the same, and it’s usually a sign of indecision.
Shooting star — a small body near the bottom of the candle, with a long upper wick. This pattern means that prices climbed during the trading session, but were eventually pushed back down.
Multiple candlestick patterns
Multiple candlestick patterns cover a series of trading periods to see what trends and changes are happening over time.
Engulfing — a small candlestick followed by a larger one that completely covers it. A bullish engulfing pattern usually means upward momentum, while a bearish engulfing pattern points to a potential downtrend.
Morning star — a three-candle formation that marks the reversal of a downward trend. This pattern is considered bullish, meaning that the market is moving away from selling pressure toward buying interest.
Evening star — a three-candle formation showing that upward momentum is fading. The opposite of the morning star, this pattern is considered bearish and means that the market might be headed into a downturn.
Three white soldiers — three consecutive bullish candlesticks. This formation means that there’s sustained buying pressure and a strong upward trend.
Three black crows — three consecutive bearish candlesticks. This pattern reflects persistent selling pressure and might mean that a downtrend will continue.
How to use candlestick patterns in trading
This is just the beginning when it comes to identifying candlestick patterns. They can help investors spot investing opportunities, but they’re also heavily used in trading to help traders choose their entry and exit points. Trading candle patterns can be useful ways to make sense of a dynamic, hectic trading environment. Here are some steps that traders might take to leverage trading candle patterns:
Review the candle chart: Analyze the chart to observe the overall market trend and identify key price levels. Pay attention to each candlestick’s shape, size, and position to get a sense of the market’s current sentiment.
Identify key candlestick formations: Look for recognizable patterns, such as the hammer, doji, or engulfing formations.
Interpret market sentiment: Look at the body and wicks of each candlestick to see what the balance is between buying and selling pressure. This can help traders anticipate when trends are more likely to continue or move in reverse.
Decide on entry and exit points: Once they identify a significant pattern, traders use it to pinpoint the optimal moments for entering or exiting a trade. This can help to limit investment risks — although trading is still a more risky approach to investing in general.
Cross-reference with other indicators: To confirm the candlestick signals, traders also check other technical indicators, like moving averages, relative strength index (RSI), or volume analysis. This also helps reduce the risk of false signals.
Benefits and limitations of candlestick analysis
Speaking of risks — these trading candle patterns help spot possible reversals and trends, but they come with some drawbacks, too. It's important to know both the benefits and limits of candlestick analysis to create a well-rounded trading plan.
Benefits of candlestick analysis
Clear visual representation: Candlestick patterns give investors a simple, visual, and streamlined way to assess the market.
Easy to identify trends: Familiar formations like the hammer or doji make it easy to know when there are potential reversals or continuations, so traders can react quickly.
Simplicity: The straightforward design of candlestick charts makes them accessible, even to investors who are new to technical analysis.
More insights: Combining the open, high, low, and close prices in one visual helps investors understand the balance between buying and selling pressure in trading.
Limitations of candlestick analysis
Potential for false signals: In volatile or sideways markets, candlestick patterns can sometimes be misleading.
Historical data: These patterns reflect past price movements and may not reliably predict market behavior in the future.
Sensitivity to time frames: Depending on the chart’s time scale, the accuracy of candlestick patterns can change.
Need for confirmation: Candlestick patterns can be misinterpreted, so it’s important to check other technical indicators as well.
In a nutshell, candlestick patterns help investors figure out what's going on in the market. These patterns can suggest when the trend might change, and traders can improve their strategies by looking at different candlestick formations. Still, it's important to use other tools to manage the risks of investing and make smarter trades.
Investments made easy
With N26, you can buy stocks and ETFs without leaving your banking app. Get started from as little as €1.
Candlestick patterns can indicate a lot about what’s happening in the market, but they do depend on market conditions and the chosen time frame. They're most effective when used together with other technical indicators to avoid the risk of false signals.
Yes, candlestick patterns can be applied across various financial markets, including stocks, forex, commodities, and cryptocurrencies. The way that they visually represent price action makes them useful in different market environments, too, although market volatility and liquidity can affect how accurate they are.
A bullish candlestick pattern means that prices closed higher than they opened — in trading jargon, that means buying pressure and a potential upward trend. A bearish candlestick pattern shows that prices closed lower than they opened — a sign of selling pressure and possible downward movement.
To confirm that candlestick patterns are accurate, traders usually cross-check them with other technical indicators like moving averages, the relative strength index (RSI), and volume analysis. This approach gives a better overview of the market and helps filter out false signals.
Yes, there are plenty of free resources online. Educational websites like BabyPips have detailed guides, tutorials, and articles that cover candlestick patterns and technical analysis concepts.
A decline in prices isn’t necessarily a sign of a full-blown market crisis. Learn what a market correction is, what causes it, and how to spot the difference between a correction and a crash.
A decline in prices isn’t necessarily a sign of a full-blown market crisis. Learn what a market correction is, what causes it, and how to spot the difference between a correction and a crash.